


Covid-19 Epidemiology: fantastic? Yes, fantastic
- Apr 22, 2021
- 4 min read

There are more things in heaven and earth, Horatio, Than are dreamt of in your philosophy.
My task is difficult – to write about unbelievable, something, in which you cannot believe even when see with your own eyes.
The epidemiological picture we see last 13 months is hardly explainable in other way than by proposition that some "space station" controls the virus's activity (both contagiousness and fatality) momentarily. This is as if some source of radiation exists that is able to modify the virus's RNA. Of course, this is not a scientific hypothesis, but the only explanation of the statistical abnormalities we all are observing, which comes into my head.
We can see many such abnormalities both on the worldwide level and on country-specific level when the dynamics of new cases and/or dynamics of deaths change sharply. Of course, the data I have access to (and, I guess, any available statistical data) are incomplete, but they cannot be explained by what we know about biology of virus. Moreover, these sharp curves and inter-countries differences cannot be explained neither quality of medicine, nor specifics of statistical services, nor the numbers of tests, nor quality of the policy of defence of vulnerable groups (like elderly). There is one more latent factor that control pandemics. And today only blind can reject seeing it.
Let us see on the worldwide dynamics of cases (the picture above).
Red circles are around points of discontinuity of derivative. Such discontinuity, when exponential growth in 1-3 days is replaced by stability or even by sharp reduction (point 5) of the number of cases, is not possible for natural epidemiological processes. Beside, in point 1-2 we see together with sharp reduction of contagiousness the equally sharp reduction in fatality – nowhere in the world we see catastrophes like in Northern Italy or in New York City in March 2020.
The statistical patterns on country level are even more surprising. Of course, there is a big temptation to explain them by bad statistical services or by effectiveness of epidemiological measures, but both explanations are insufficient to explain these wonders.
Below there are only few examples starting with what happened in France and Belgium where exponential growth in 1 day became exponential reduction.


Vietnam.

NeitherbeforeAugust of 2020, nor after there have been no deaths in Vietnam. But in August fatality reached near 30% when 1 from 3 who became ill died.


The first death in Mongolia happened in the last days of December 2020. All year there were no deaths. But in last month starting from 8th of March we see explosion of deaths together with similar explosion in the number of cases.
The similar situation is in Cambodia: nothing before February 2021, first death only 11th of March, 2021. But after that we see many cases and many deaths.


Laos is still has a good epidemiology – not more than few cases per day and there are no deaths at all. But for how long? In neighbouring Cambodia we saw the same. [For 2 days I wrote this article the explosion happened in Laos too – today, 21/04/2021 there were 28 cases almost half of what was found in 16 months before]. The similar curves we can see in other Cambodia's neighbour – Thailand. Whole Indochina was oasis of mild pandemics until recently, but not today.
The similar picture we can see in Tajikistan, poorest from Soviet republic: sharp start in May 2020 and equally sharp end in the end of December.

Only few weeks ago Central Europe was under most pressure of pandemics. Today the situation there is improved significantly (of course partly because of lockdowns that were introduced by some governments, but not only because of them). But at the same time the situation in South America became much worse.
In historical retrospection we can see the drastic difference between New York and other states last spring or between Italy and its neighbours same time. Now the situation with fatality is much milder in both New York and Italy that I mentioned above.
Below is the picture of cases (axis X) vs. fatality (axis Y) as 10/04/2021. Colour contours are geographical regions.

The differences between minimal and maximal fatalities and between minimal and maximal numbers of cases per 1 million of population (between less damaged and most damaged countries) reach several orders of magnitude. When the picture above was drawn the Central Europe was most damaged in terms of number of cases and Latin America in terms of fatality. The less damaged both in terms of cases and in terms of deaths was Far East and Indochina. Among European countries the best situation there was in Scandinavia (except Sweden). The states of Central Asia with very bad medicine were in very good epidemiological conditions. The virus as if is merciful to underdeveloped countries and hit the countries that are trying to ignore him. For example both indicators (the number of cases per 1 million population and the number of deaths per 1 million population) for Sweden with its "special way" of ignoring pandemics (correspondingly, 9% and 0,14%) in several times worse than for neighbouring Norway (2% and 0.013%) and Finland (1.5% and 0.016%).
If we compare the picture above with analogical picture I drawn at the end of May, 2020, we can see significant differences.

Both Central Europe and most of Southern America were among safe regions while today they both are far from safety.
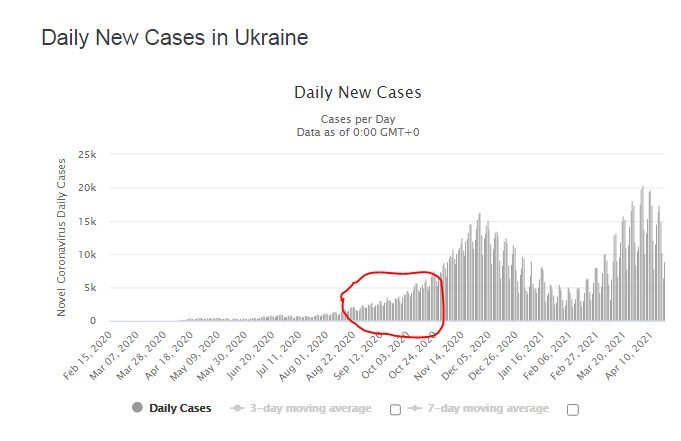
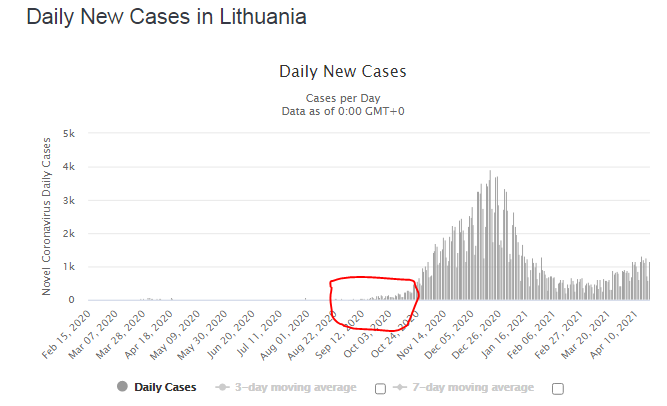
It is interesting to compare the Belarusian curve in the weeks of mass protests (and correspondingly neglecting social distancing and other quarantine measures) against usurpation of power by Lukashenko (September-October, 2020) with similar curves of neighbouring Ukraine and Lithuania (comparing with Russia is meaningless because of unreliability of Russian Statistic). In both Ukraine and Lithuania we observe different phases of exponential growth. But in Belorussia the virus after elections as if stops for 4-7 weeks.


If not fantastic, what?
I do not see neither simple nor complex scientific explanations of these facts but only one non-scientific: the humankind receives some message. Astrophysicists try to find the regular patterns in stars' radiation as a proof of intelligent life there. In our case we observe such patterns here, on Earth.
What is the meaning of this message? We will start understand it when our attempts to end the pandemics with vaccination will become successful or fruitless. It is too early to discuss this topic today basing on the data we possess. Today we simply do not understand what happen. And what is worse we are afraid to understand and because of this do not understand at all the simple fact of our non-understanding itself.


Comments